Logs
This section explains the log reports available within the Admin Interface. The following topics are covered in this section:
Viewing logs
Log information provided on this page is split into events that occur against the different Osirium PAM service types. Each tab contains information for a specific service, allowing you to easily target your search.
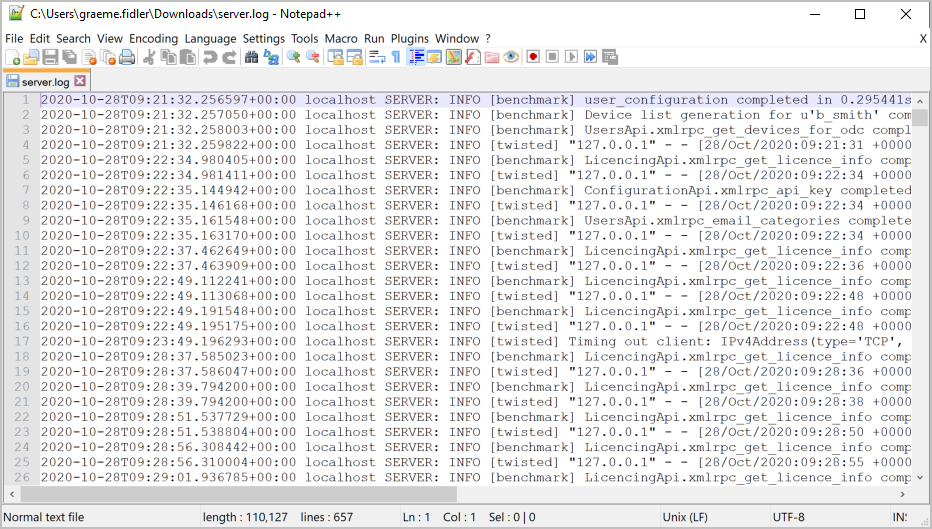
Logs can be downloaded for each individual tab using the DOWNLOAD button. The downloaded file is saved as something.log on your local workstation and can be viewed in an external text editor.
The following is a view of the Server log tab.

The following is a view of the Server log downloaded and viewed in an editor.
The following describes each of the services and what they do, to help you pinpoint the right log when troubleshooting issues.
| Heading | Description |
|---|---|
| Server | Handles the XML remote procedure calls (RPC) from the Admin Interface and loads device templates, when device tasks are being executed. |
| Proxy | Handles the connections between the user's workstation to the end device, when a device is accessed. It's responsible for injecting the authentication requirements to enable the user to connect to the device. |
| Proxy Channels | Lists all successful proxy connections with corresponding channel IDs. Proxy connections act as the middle-man throughout the connection life cycle, so users never have to know the device login credentials. |
| External | Used to authenticate the user logging on and produces the device and task list the user has permission to. Any device permissions are dynamically published and device monitor states updated. This service will also manage the authentication for users that are authenticated against RADIUS or Active Directory. |
| Userauth | Logs user login attempts and failures based on the users auth type (local, RADIUS, Active Directory or multi-factor). |
| Cluster | Audits the cluster, logs nodes joining the cluster and displays cluster errors. |
| Rest | Used to handle requests and receive responses via HTTP protocols. |
| HA proxy | Used to manage and load balance high availability of device connections. |
| Session recording | Used to receive screenshots sent from the users workstation, stores them and creates a database record for each. |
| Task tracker | Used to maintain an accurate record of the system tasks that are run in the background. |
| MAP Server | Logs MAP sessions and which device template script was used. |
| Key Verifier | Logs fingerprint verifications associated with a device when a connection is made to a device tool. |
| API | Logs all the API calls that are made and shows you the client that made the call and which API call was used. API logs can be found in: /var/log/osirium/rest-api.log |
| SMTP Email | Logs listed are from the SMTP debug log file. They log the communication between Osirium PAM and the configured SMTP server. Shows any issues with sending emails through error messages that come back from the SMTP server. |
| UI Session | Session manager logs that monitors the logins and logouts on the UI. |
| UI API | Log of all the REST API calls made through the UI. |
| UI Device | Logs all the device tool connections i.e. RDP, SSH made. |
| UI Session Recording | Used to receive screenshots taken during the connection through the UI, stores them and creates a database record for each. |
| UI Socket.io | Logs the communication between the web client and Osirium PAM. |
| SAML2 | Used to maintain records of SAML logins and configuration changes to the SAML service. |
Logging levels
The Osirium PAM event occurrences are given a logging level of either: Debug, Info, Warning, or Error.
The table below describes when logging is used:
| Level | Description |
|---|---|
| Debug | Provides detailed information to help with diagnosing problems By default debugging is turned off. To enable the debug logging mode see Debug Task Logging. |
| Info | Information to confirm that the service is working as expected. |
| Warning | Gives an indication that something unexpected happened. The service is still working as expected but something to be aware of. |
| Error | Indicates an exception has occurred and there maybe a problem. |
Log file directory
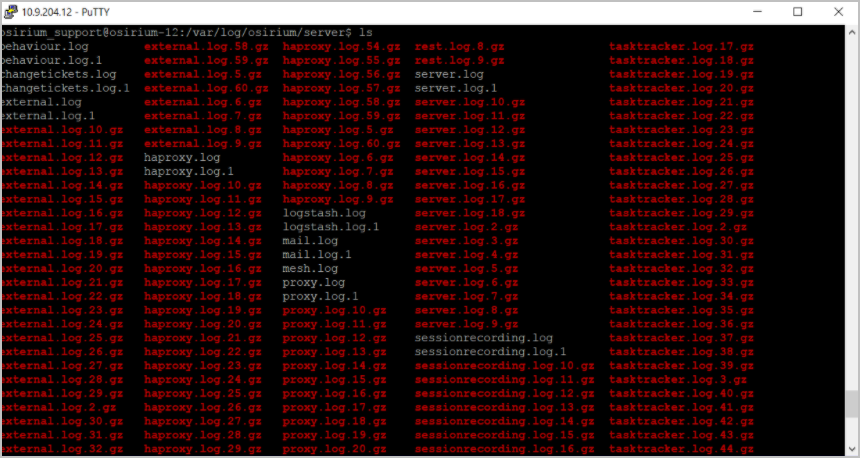
All log files are stored in plain text on the virtual appliance local filestore and can be found in the /var/log/osirium/server directory. They can be accessed using a BASH command and logging in as the osirium_support account. See Support Account.
Logs are rotated automatically once a day and kept for a maximum of 84 rotated logs, after which they are deleted. Rotated logs are archived as compressed GZ files.
The following is an unfiltered view of the log files found in the /var/log/osirium/server directory.
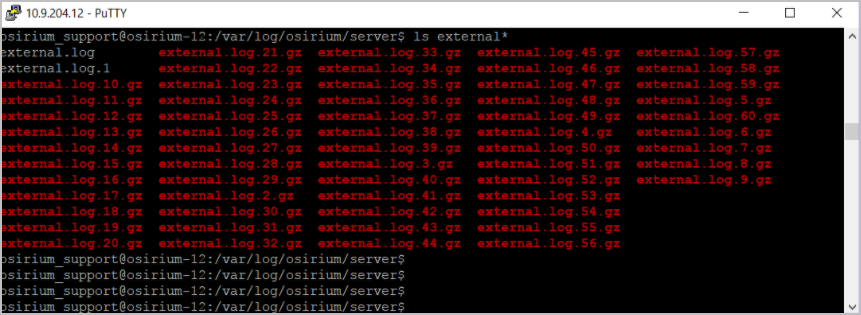
The following is a filtered view for the external log files found in the /var/log/osirium/server directory.
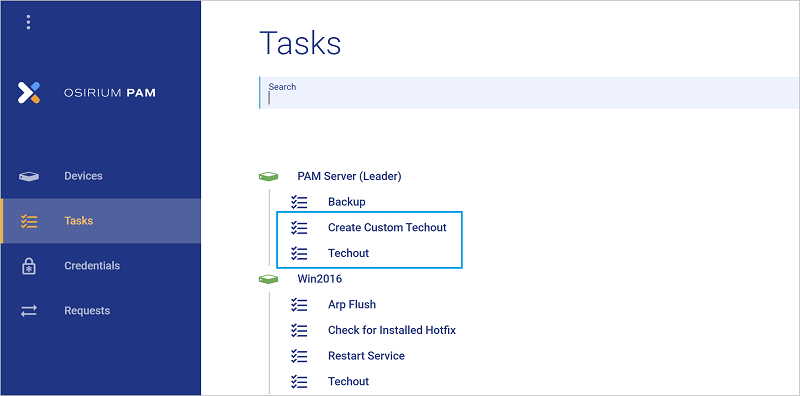
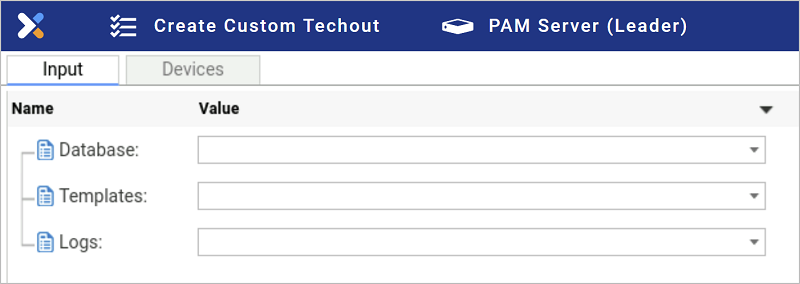
Log file techout
A techout is a TGZ archive file that gathers system and configuration information. A techout task can be run against the PAM Server which will include all the log files. Alternatively, you can create a custom techout which will allow you to select:
- Include all: which will include logs that are up to 84 days old.
-
Include recent: which will only include logs that are 10 days old.
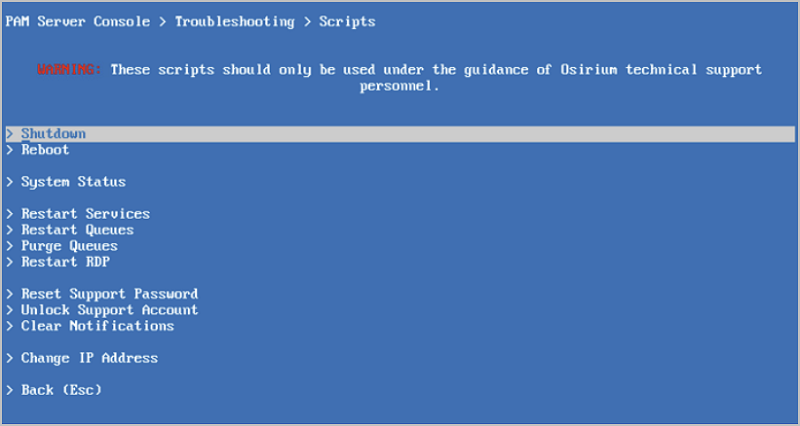
Troubleshooting
A number of troubleshooting scripts are available through the PAM Server console screen to help you manage system and service tasks.
To view the console window:
-
Logon to your existing infrastructure and open the console window of the PAM Server.
-
Within the blue screen console window, select
Troubleshooting.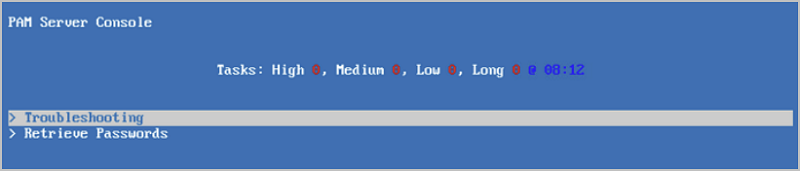
-
Now enter the username and password of a SuperAdmin account.
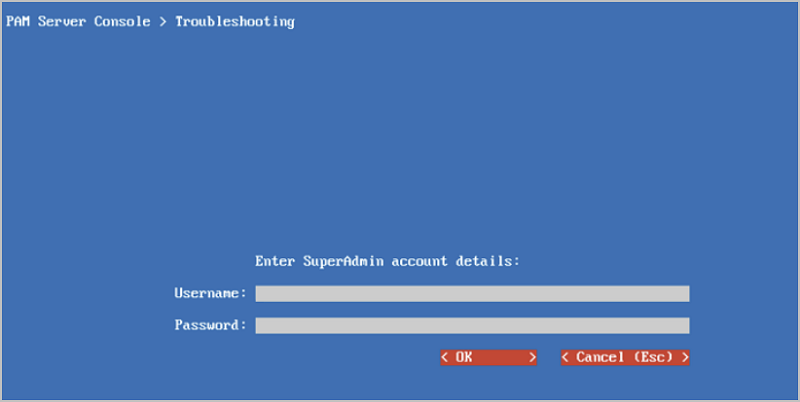
-
You will now see the list of troubleshooting scripts. These are the tasks that can be run on the server to help resolve issues.