Analytics
This section looks at your analysed Osirium PAM data. The topics covered in this section are:
Introduction
The analytics have been built around key factors including:
- Start Time
- Session Length
- Accounts Used-
- Originating IP addresses.
All of these data points link back to Osirium reporting. Graphs show the trends, but reporting holds the specifics.
These analytics show how individuals are working within the group. You can see how the server and network team behave. Taking different views lets your see the outlying data points quickly.
The analytics page provides a default number of data patterns based on your analysed Osirium PAM data. The data can be displayed in graphical as well as table format.
The default data patterns created are:
Event timeline
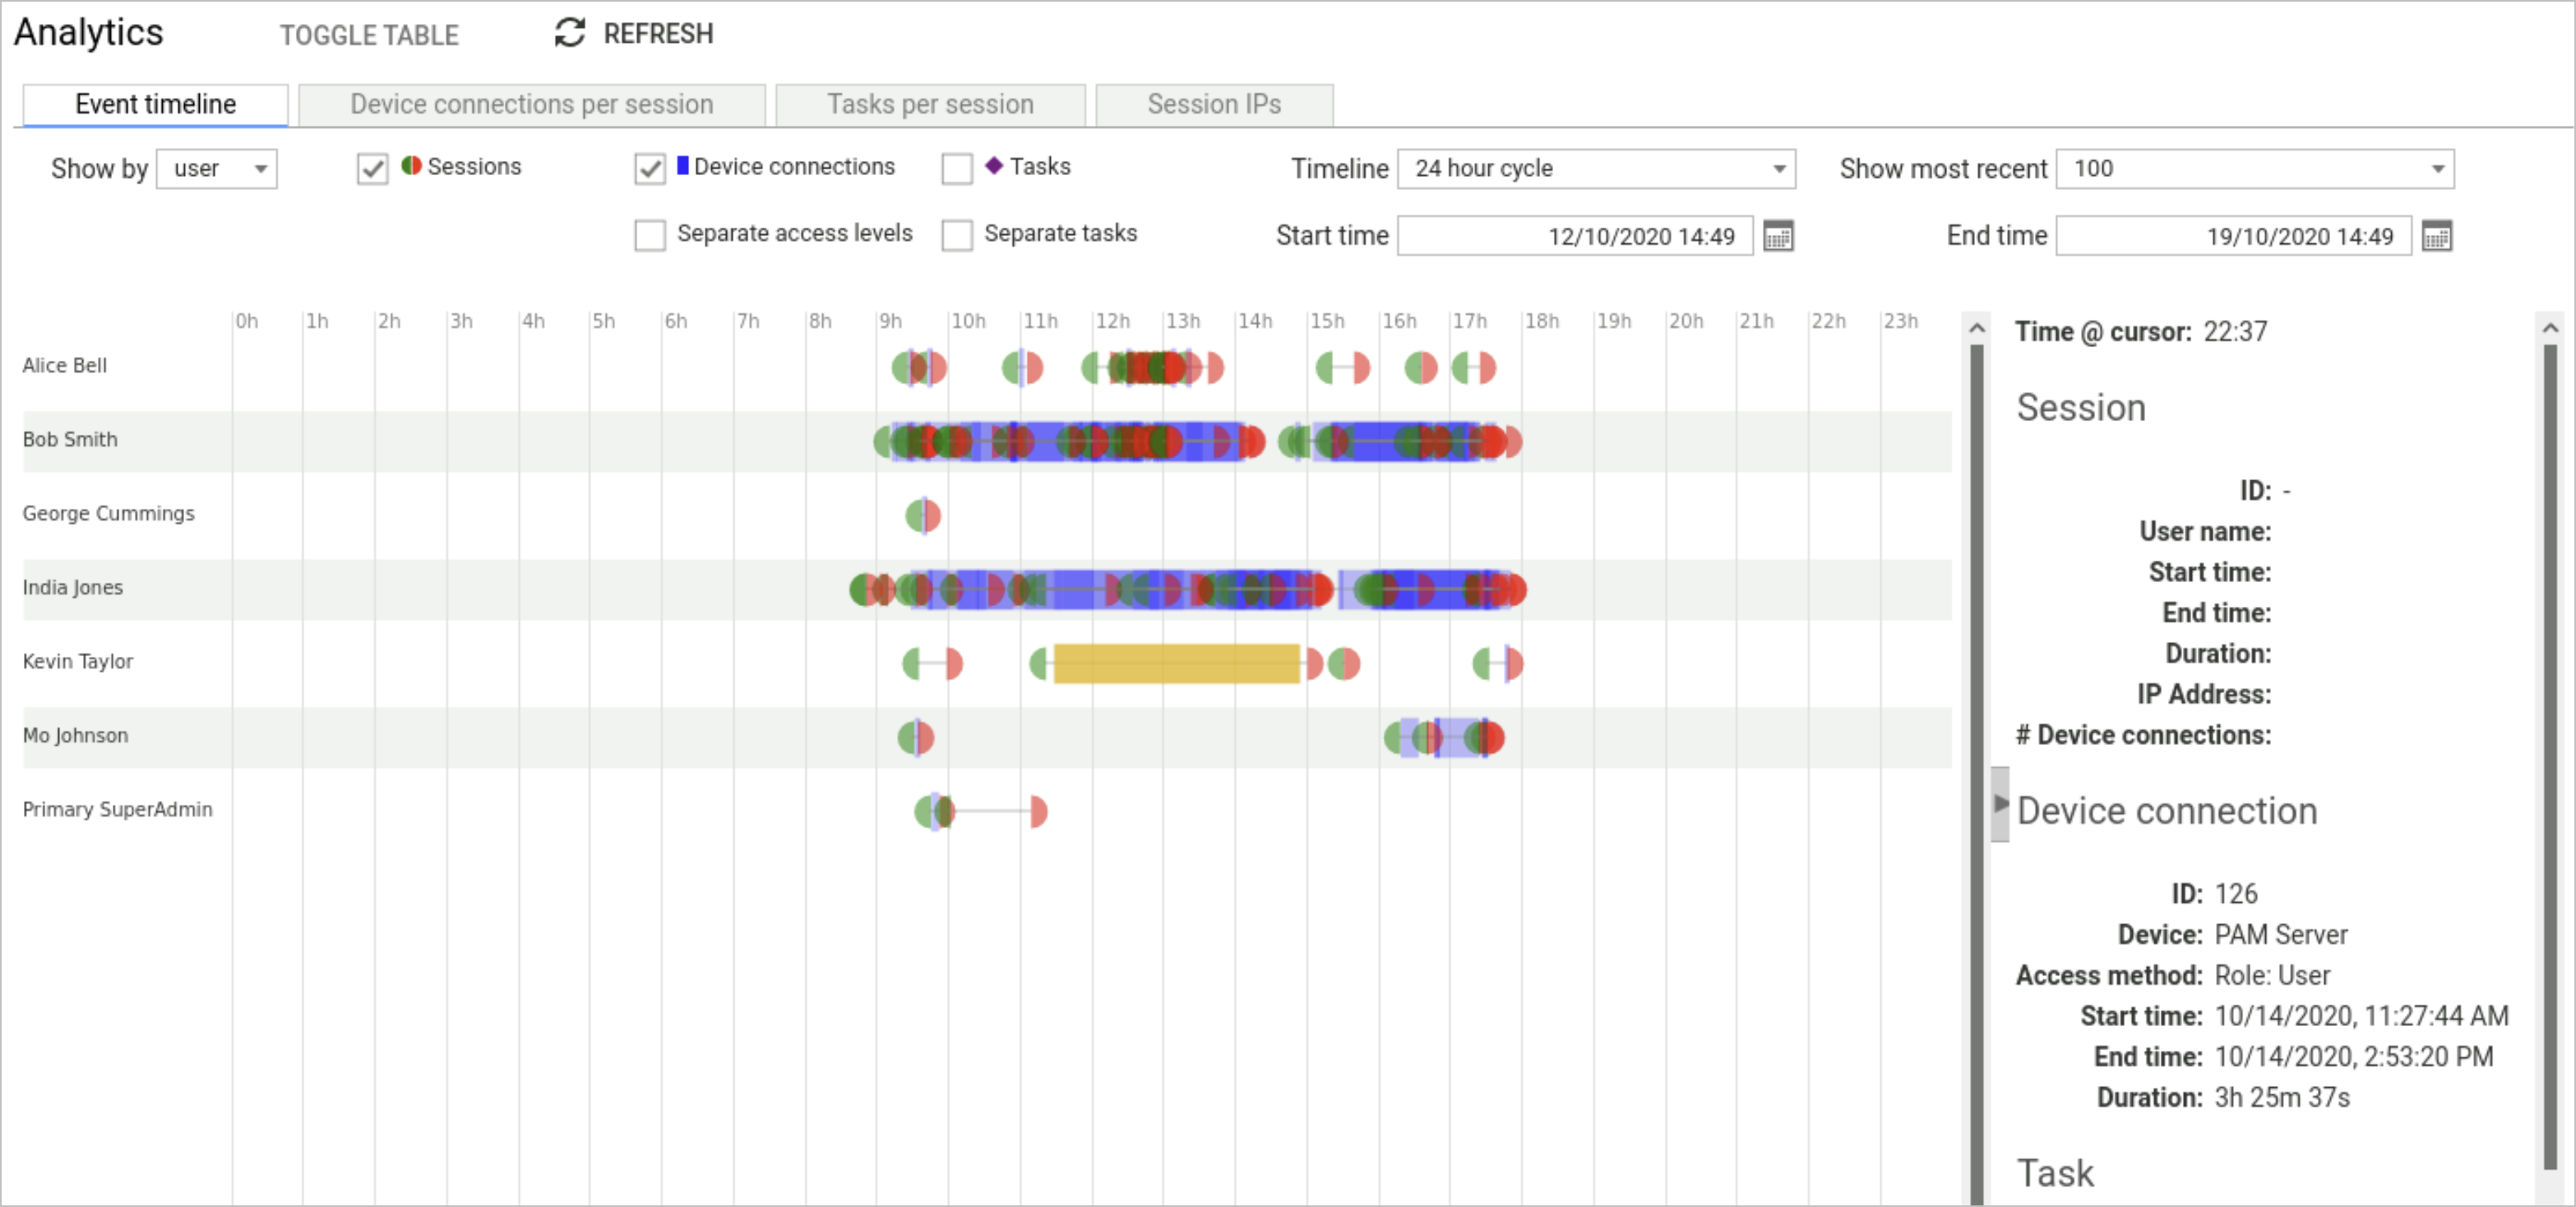
The Event timeline can be filtered by using the following options:
| Option | Description |
|---|---|
| Adds a marker to the chart to show when the UI connection was started and ended. | |
| Adds a marker to the chart that shows when a connection was made to a device through the UI. | |
| Adds a marker to the chart when a task has been run. | |
| Timeline | Allows you to select the time viewed on the chart. |
| Show most recent | Allows you to show the most recent connections. Options available are: - 100 - 200 - 500 - 1000 |
| Separate access levels | Adds a line for each access level so they can be viewed separately per user/device. |
| Separate tasks | Adds a line for each task so they can be viewed separately per user/device. |
| Start time | Select a date you want to view the data from. |
| End time | Select the date you want the data to end. |
Right-clicking on a data entry point allows you to select the following options from the context menu:
| Option | Description |
|---|---|
| Show session | Navigates you to the Device access report and filtered by your selection so you can view the correct entry selected. |
| Show device connection | Navigates you to the Device access report > Device connections tab and filtered by your selection so you can view the correct entry selected. |
| Opens the Session Player window and plays the Session Recording for the Device connection selected. See Session Recording. | |
| Set start time | Clicking on the chart and then selecting Set start time changes the filter Start time to the one selected on the chart. |
| Select end time | Clicking on the chart and then selecting Set end time changes the filter End time to the one selected on the chart. |
| Zoom in (+) | Allows you to zoom in on the section of the chart you have selected. |
| Zoom out (-) | Allows you to zoom out on the section of the chart you have selected. |
Clicking on a data entry point in the Gantt chart updates the right-hand table to show detailed information about the UI sessions and Device connection selected.
The information presented in the table includes:
| Heading | Description |
|---|---|
| ID | Unique ID given to the UI session. |
| User name | The name of the user that was logged onto the session. |
| Start time | Date and time the user logged into the UI. |
| End time | Date and time the user logged out of the UI. |
| Duration | The total time the user was logged onto the UI session. |
| IP Address | The IP address of the connected user’s computer. |
| # Device connections | The number of device connections the user has made through the UI. |
Device connections per session
The PAM session duration (min's) vs. Device connections/minute graph shows the duration of the UI session against the number of device connections made per minute during the session period.
Each user is represented by a different colour and shape. Hovering the mouse over the entries provides information about the data entry point.
Clicking on a data entry point navigates you to the entry in the Device access report > PAM sessions screen.
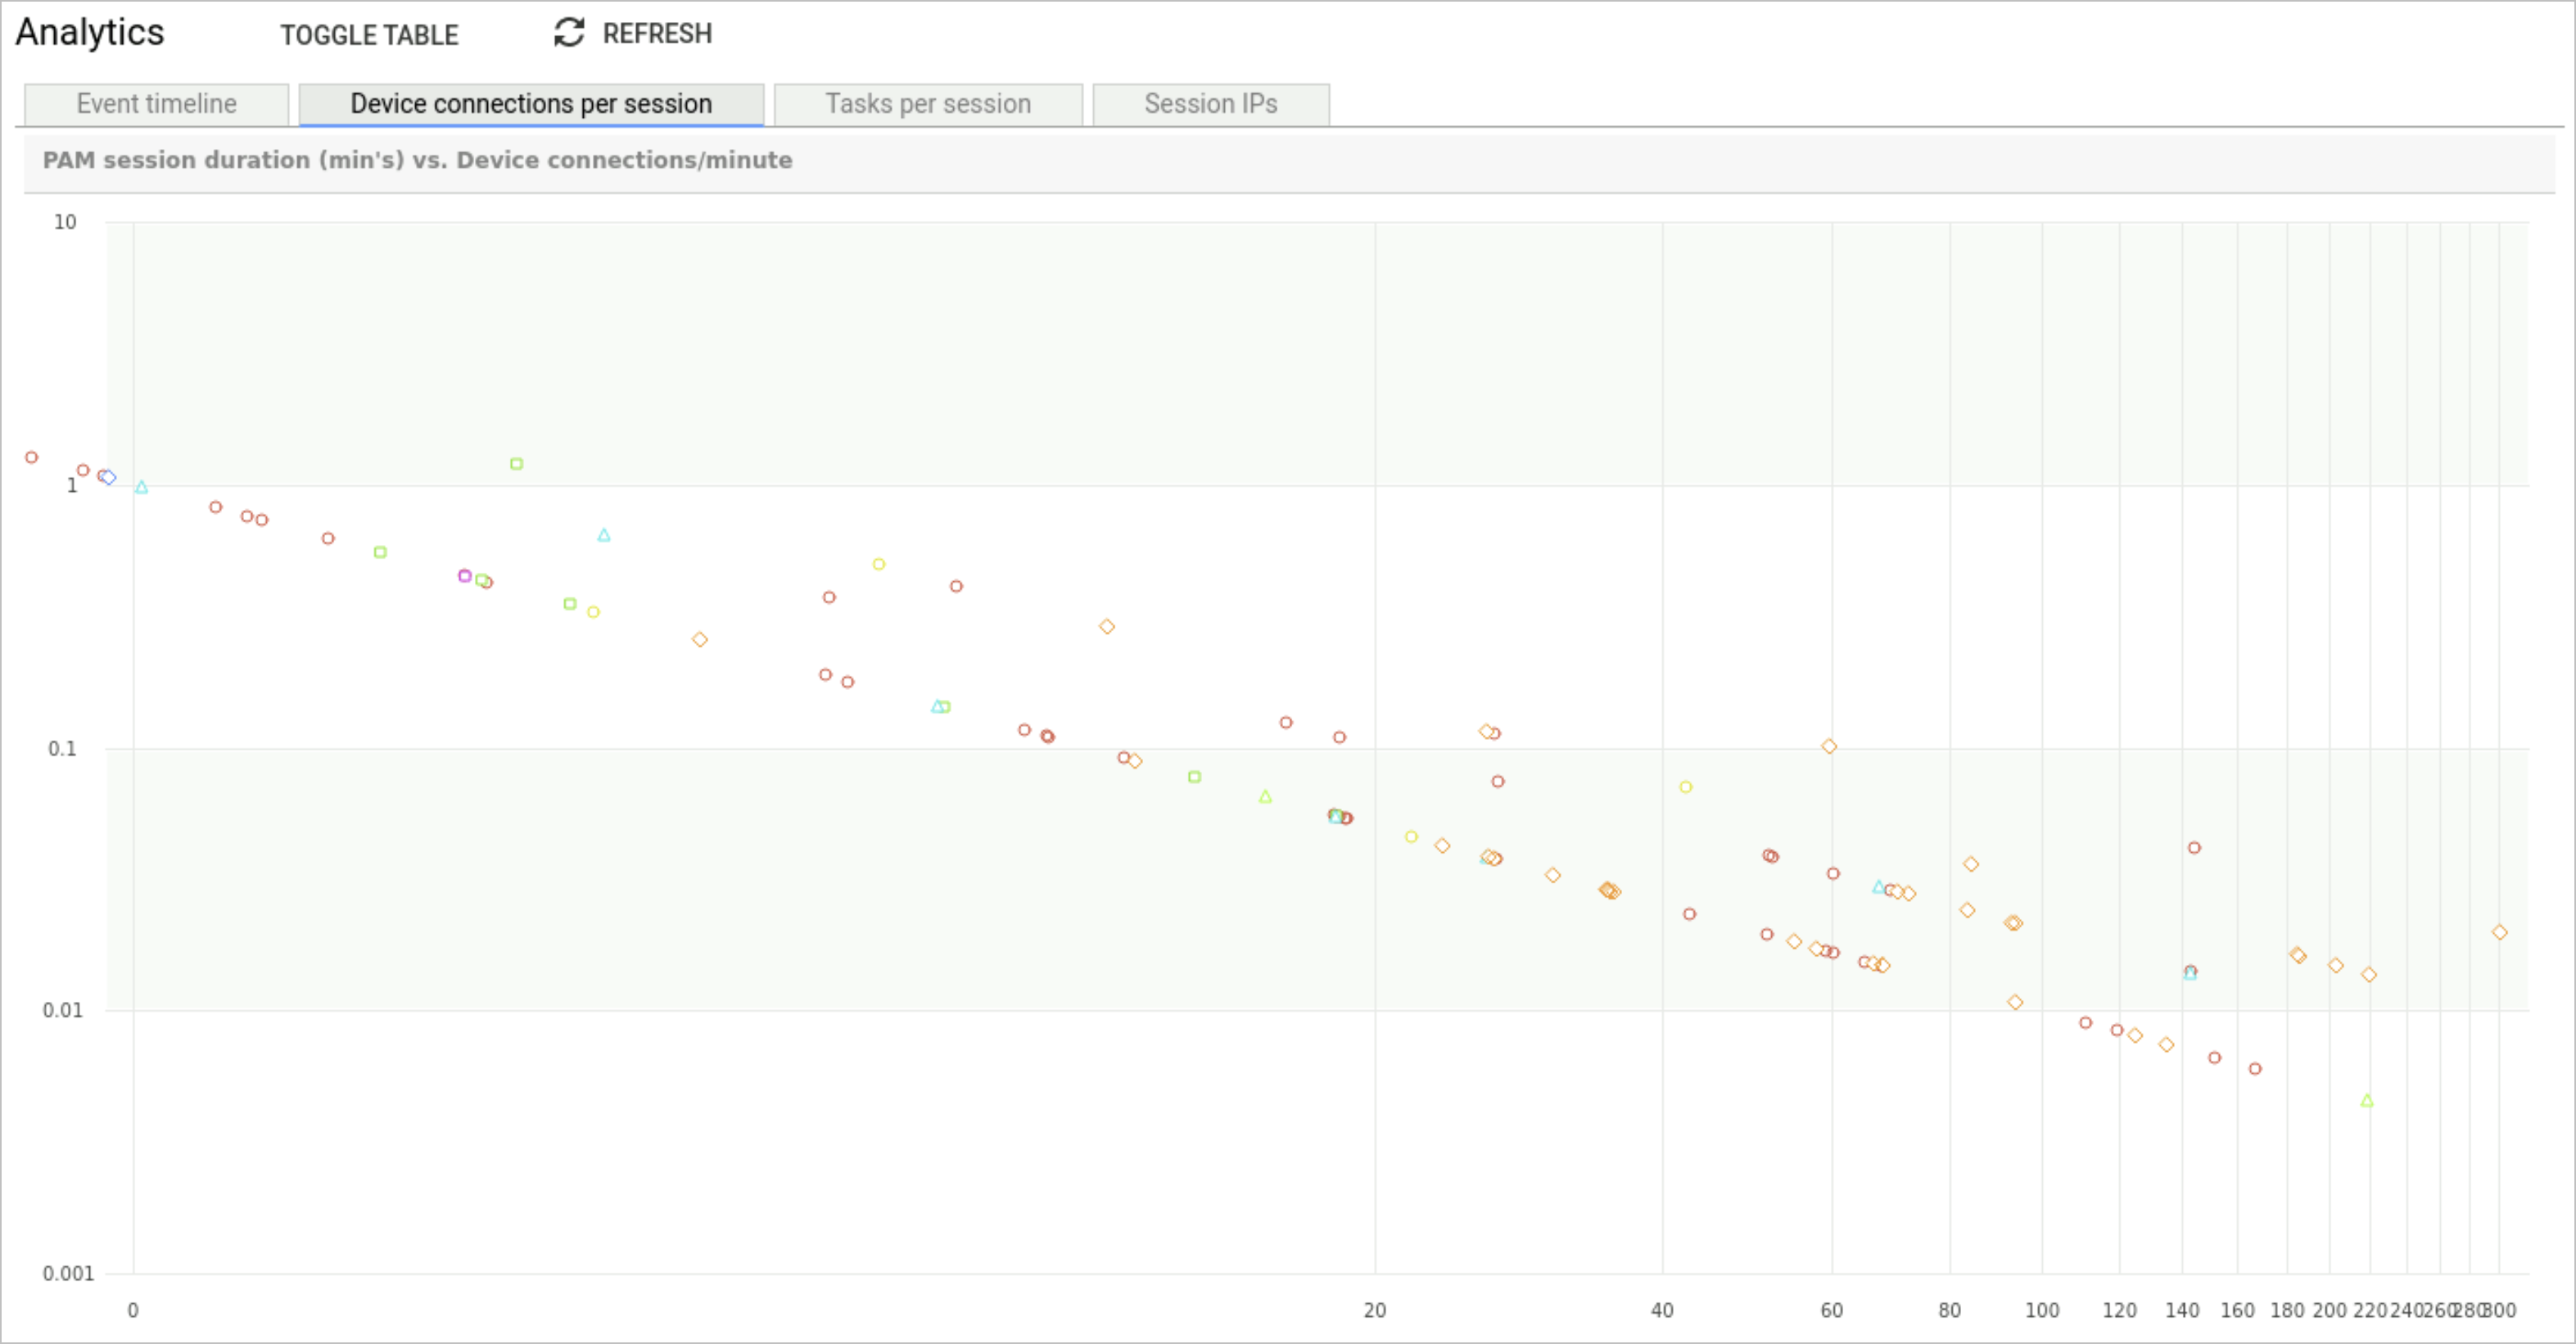
To view the data entry points in a table view, click the TOGGLE TABLE button.
The information presented in the table includes:
| Heading | Description |
|---|---|
| ID | Unique ID given to the UI session. Clicking on the link navigates you to Device access report > PAM sessions and filters by the ID. |
| Duration | The total time the user was logged onto the UI session. |
| # Device connections | Number of connections made to devices during the session. |
| Connections/minute | Average number of channels opened during the session per minute. |
| User | The name of the user that was logged onto the session. Clicking on the link navigates you to the user detail page. |
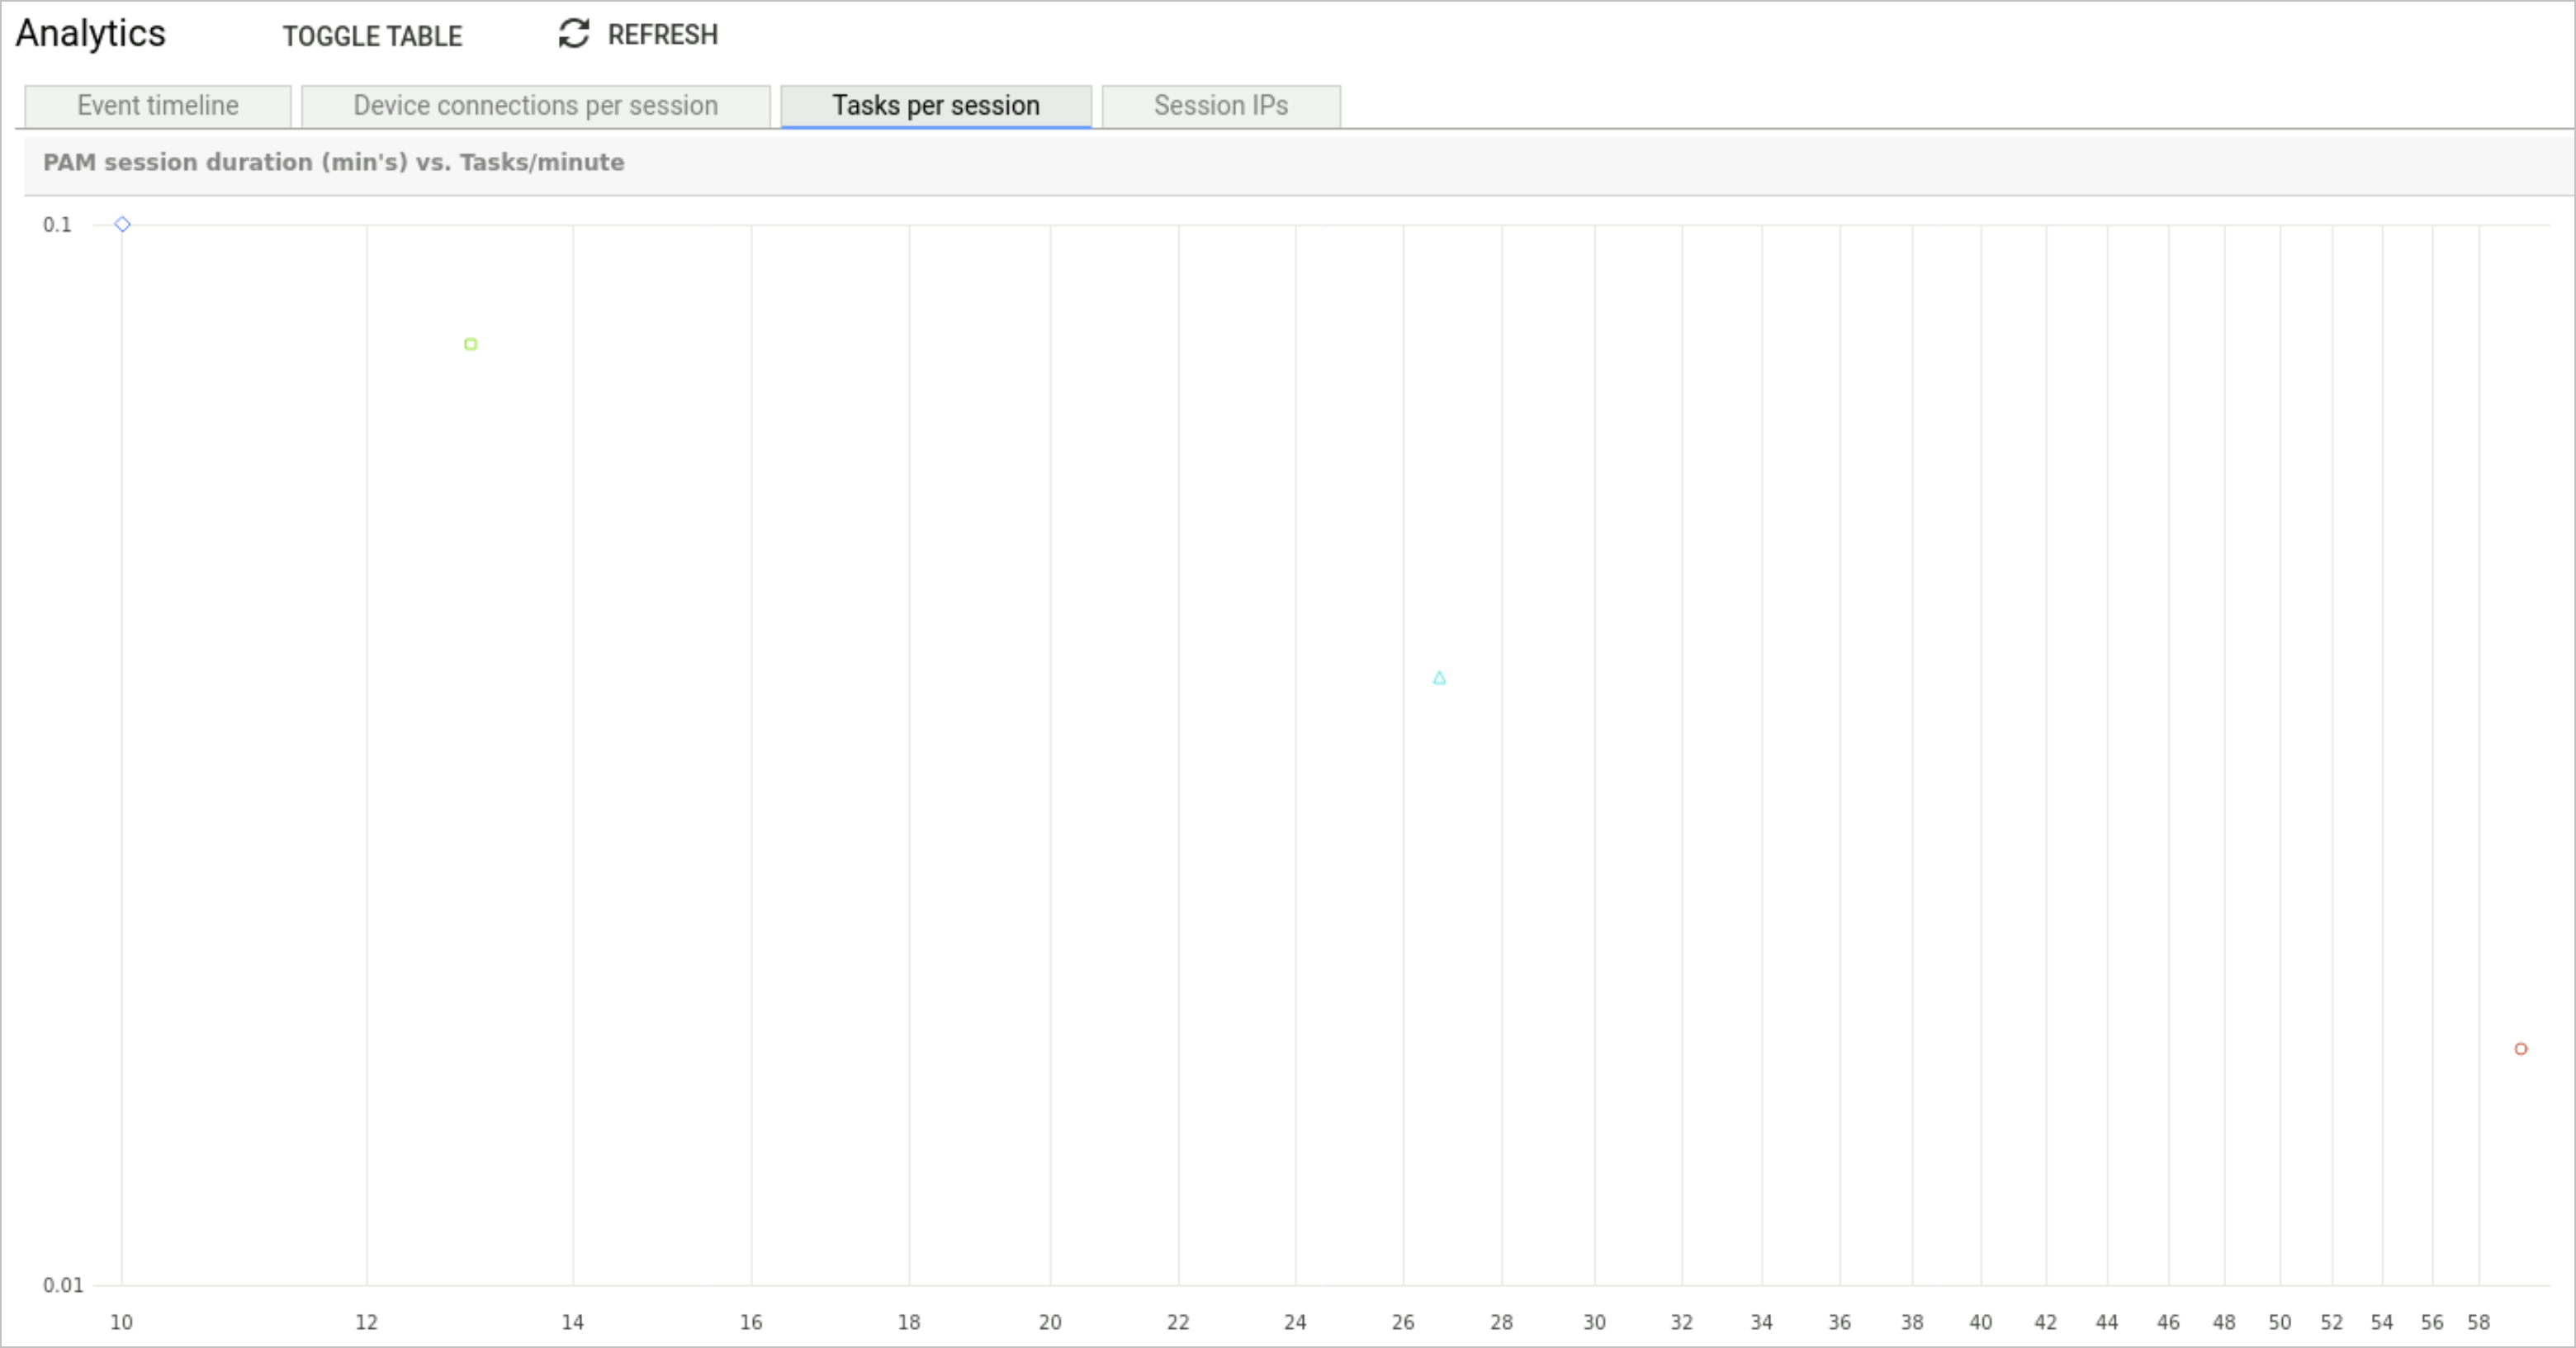
Tasks per session
The PAM session duration (min's) vs. Tasks/minute graph shows the number of tasks executed during the UI session.
Each user is represented by a different colour and shape. Hovering the mouse over the entries provides information about the data entry point.
Clicking on a data entry point, navigates you to the entry in the Device access report > PAM sessions screen.
To view the data entry points in a table view, click the Toggle table button.
The information presented in the table includes:
| Heading | Description |
|---|---|
| ID | Unique ID given to the UI session. Clicking on the link navigates you to the Device access report > Desktop Client sessions and filters by the ID. |
| Duration | The total time the user was logged onto the UI session. |
| # Tasks | Number of tasks run by the user during the session. |
| Tasks/minute | Average number of Tasks run during the session per minute. |
| User | The name of user that was logged onto the session. Clicking on the link navigates you to the user detail page. |
Session IPs
The Session IPs table shows the IP address of where the session connections to the UI originated from. From this data, you can determine if multiple users are logging in from the same IP address and address any concerns.
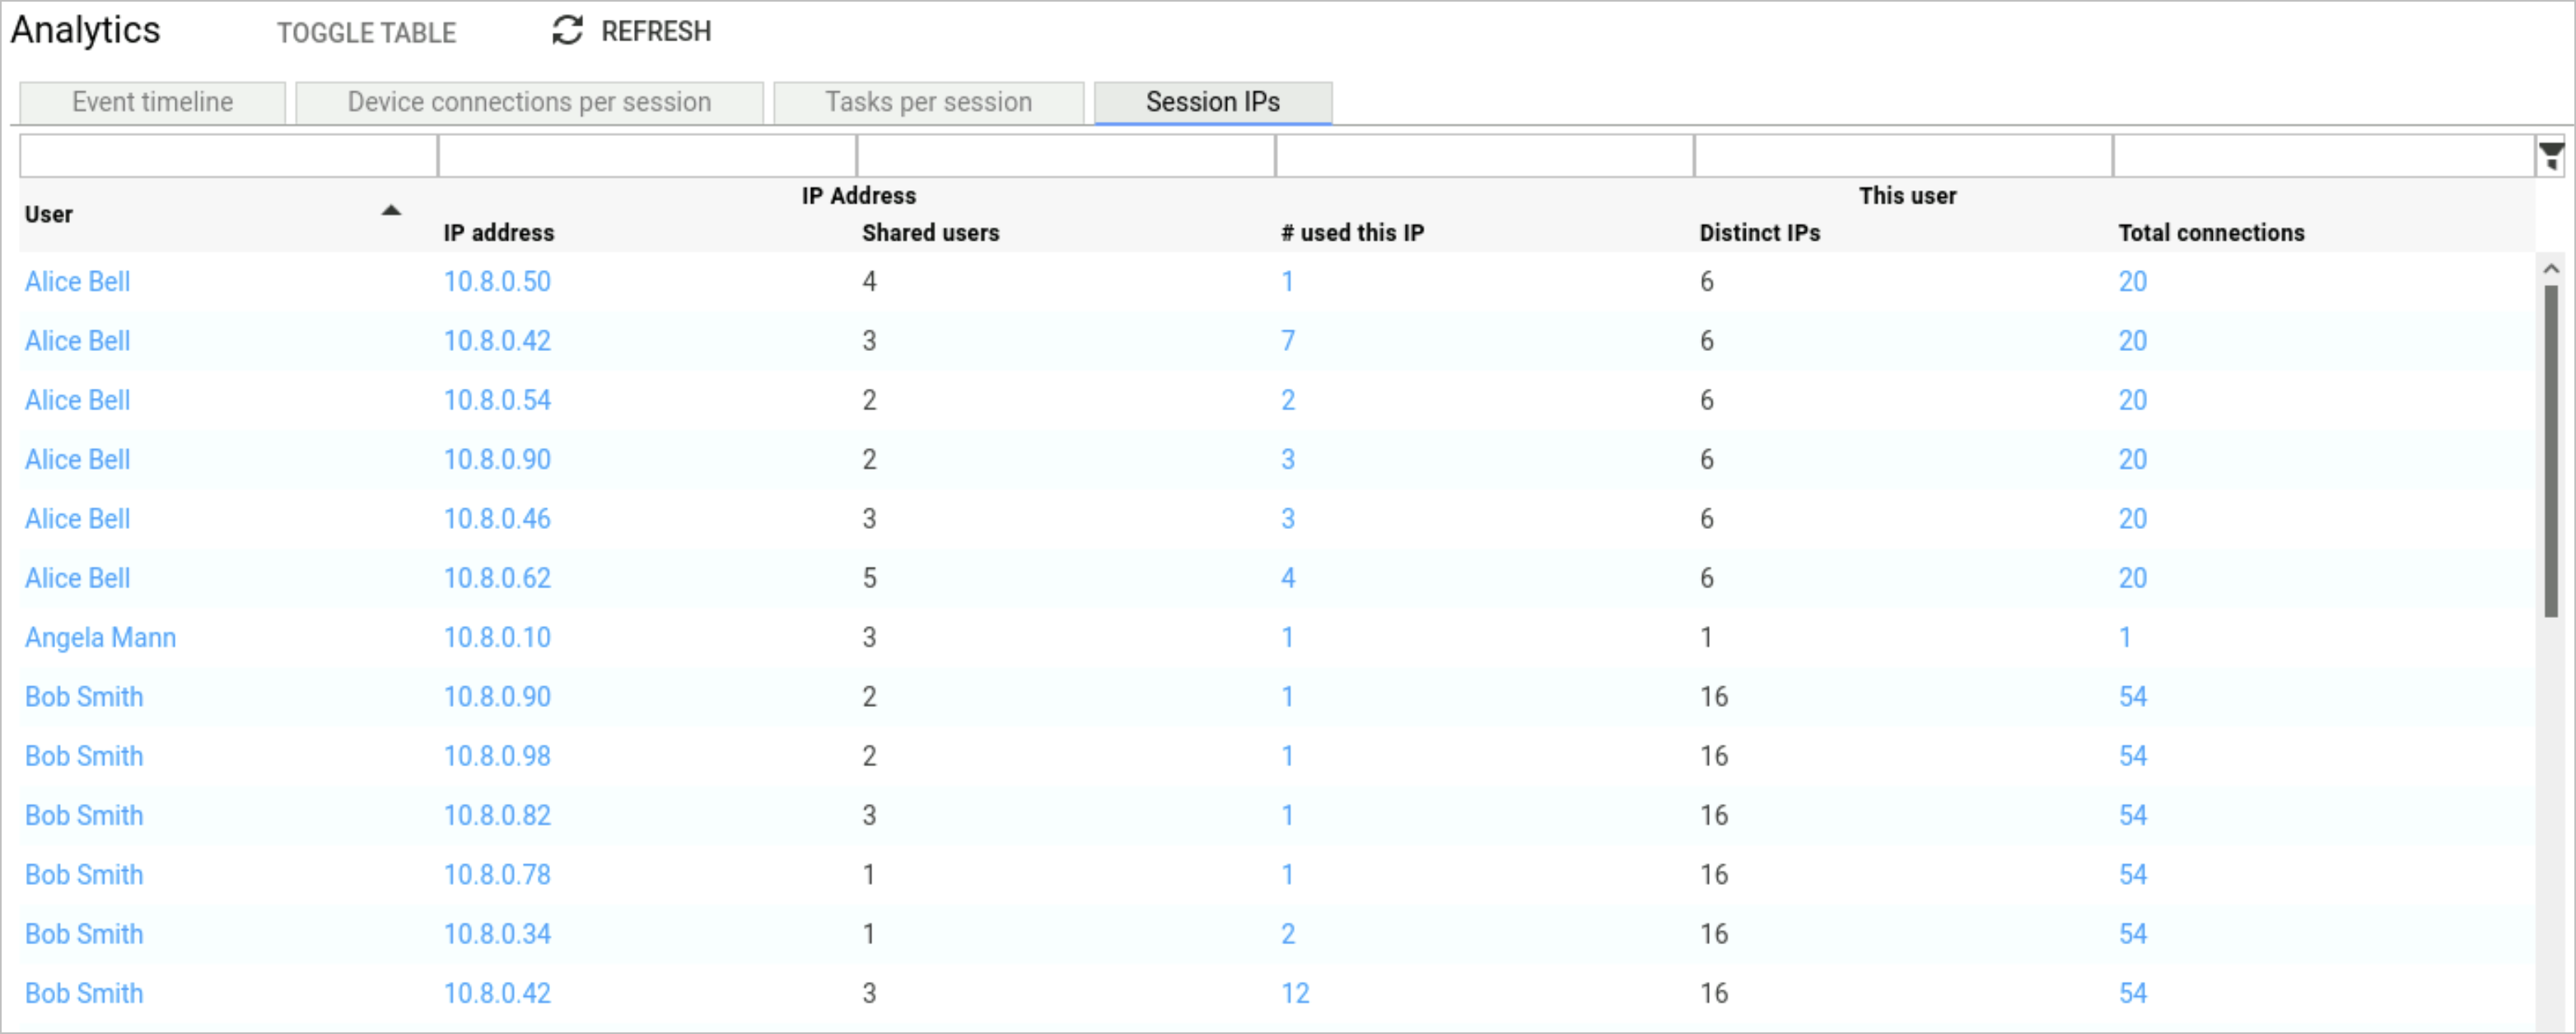
The information presented in the table includes:
| Heading | Description |
|---|---|
| User | Name of the user the Session IP was used by. If the username is shown as |
| IP address | IP address of where the session was initiated from. Clicking on the IP address link navigates you to the entry in the Device access report > PAM sessions tab. |
| Shared users | Indicates the number of users that opened sessions from the same IP address. |
| # used this IP | Number of times the session was opened from the IP address. |
| Distinct IPs | Indicates the number of different IP addresses a user has logged on from. |
| Total connections | Indicates the total number of connections made from the IP address. |